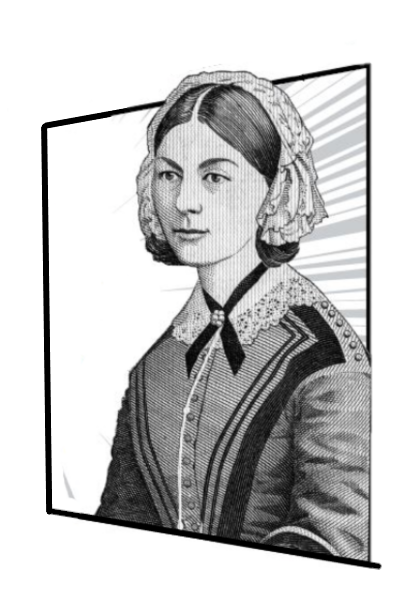
In the Covid-19 pandemic we were reminded of the importance of front-line workers, especially nurses. Florence Nightingale is considered the founder of modern nursing and her 200th birthday fell on the 12 May 2020. But, her legacy is even greater, we know the crucial importance of good hygiene and the importance of proper data in fighting the spread of the virus. These are the very areas that Nightingale also pioneered and deserves to be remembered for. We celebrated Florence Nightingale in our Maths Week 2020 poster.
Florence Nightingale is regarded as the founder of modern nursing. But, did you know that she was also an important figure in the history of statistics. She was born in Florence in 1820 into a wealthy English family. She was born on 12 May, a day now coincidentally designated as International Women in Mathematics day, and showed great talent in mathematics from an early age.
She was never content to fill the role that society at the time expected of a lady and defied her parents to become a nurse. Florence went to the Crimean War to tend injured soldiers where she found that far more soldiers were dying of disease than wounds. She tried to improve hygiene but found it difficult to persuade those in power.
She gathered data about deaths in hospitals and her statistics showed that poor sanitary conditions were the cause of high mortality rates. Concerned that politicians wouldn’t understand the statistics she developed visual displays similar to the pie chart that is common today. This had a huge impact on the design and operation of hospitals resulting in a significant drop in death rates. This also popularized the use of graphs and charts to convey information and now important policy decisions are informed by statistics. Florence died in London in 1910 having made a huge contribution to health, social reform and statistics.
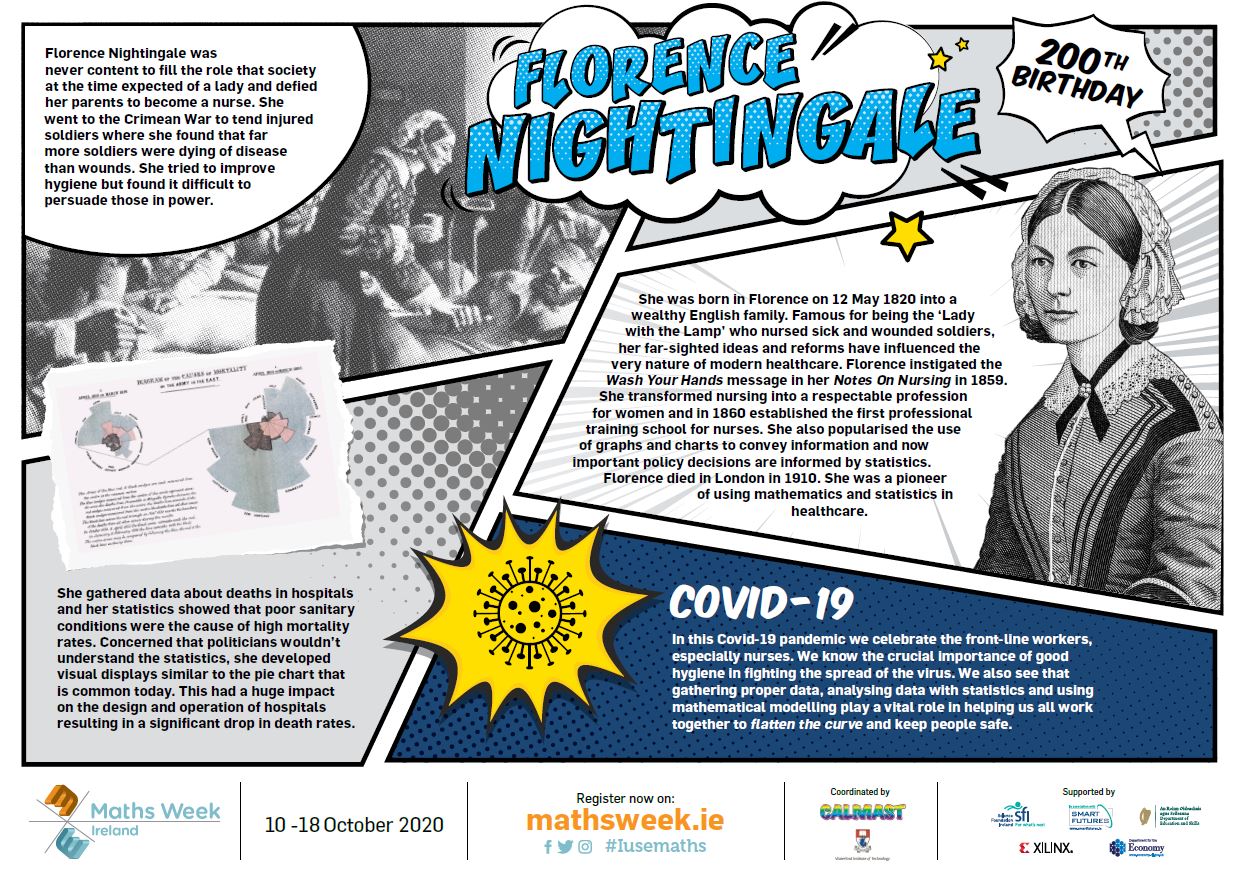
The image below shows our poster which was distributed to all secondary schools in Ireland, North and South. It was produced by Maths Week Ireland to mark the 200th Anniversary of Florence Nightingale’s birth. In the first panel we see Florence in her role in the Crimean War where she collected data on the mortality rates of different hospitals.
In the second panel are some of her Rose diagrams – charts she used to convince the men of power of the importance of changing hygiene practices in hospitals. They convey information in a way that clearly shows trends in the data and were able to quickly convince the reader. This is the first model for the modern pie-chart that is now more commonly used to convey such information.
Click on the image below for a larger version

